The Oregon Fix - Part 6

Part 6: Counties Trending More and More Toward the Republican Party
Oregon has 36 counties, and at the 2020 election, 23 of these counties had a higher ratio of registered republicans to democrats than at any time since 1988. In other words, while there are 5 counties which are clearly trending toward the democratic party in this state, there are 23 counties clearly trending toward the republican party. That’s because while these 23 counties cover most of the land area in the state, they only account for about 19% of the population. For a couple of these counties there are still more democrats than republicans registered, but every one of them are demonstrating that in 2020 they were trending more and more toward the republican party. Looking at this data you will see a big surprise, and it is almost unbelievable, but it is clearly true.
The voting versus registration graphs for these 23 counties will show you that in every case these counties voted more heavily for Biden than the ratio of registrations would predict. 23 out of 23 times. And in 19 of the 23 counties the difference was statistically significant.
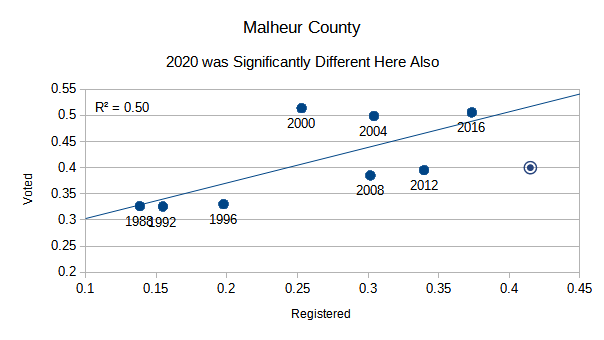
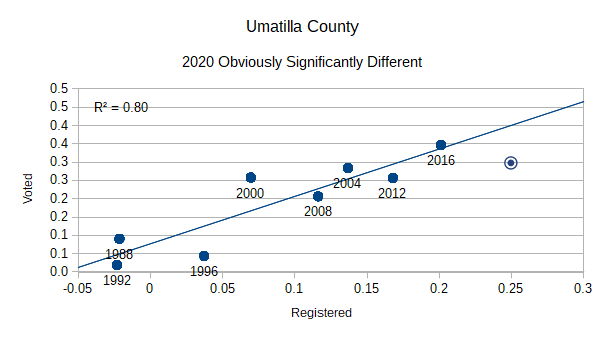
That is an unusual and amazing fact! Remember that of the five democratic trending counties, two fit the model nearly perfectly, one trended more democratic than would be expected, and two trended more republican than would be expected. Pretty much evenly split in their voting behavior compared to their past history. That’s normal, but that's not the case here. The graph for each of these 23 counties are shown below in alphabetical order, with only a few comments. The subtitles on each graph tell whether the difference in that specific county is significantly different from the prediction. Note that the vertical and horizontal scales on the graph change from county to county to show the data more clearly.

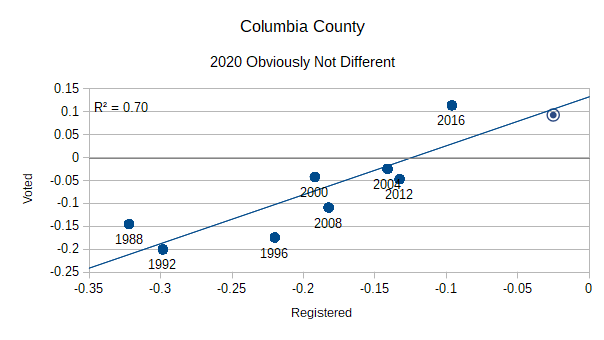
Columbia county is a county which has been democratic both in registration and voting, until 2016. They still have more registered democrats than republicans, but barely so. Only 1.06 democrat voters per republican voter as of June 2022. And of all of these counties, this one came closest to the predicted model, but it still voted 1.42% more for Biden than would be predicted, see the graph below.
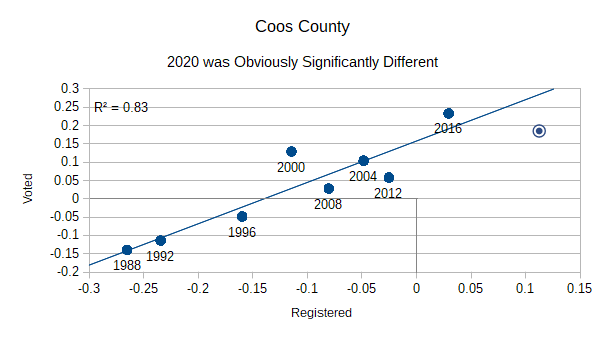
Coos county was also a democratic county until 2000 when they voted more heavily for George W. Bush, and starting in 2016 republican registrations were larger than democratic registrations. But in 2020 they also voted significantly more heavily for Biden than would be expected.
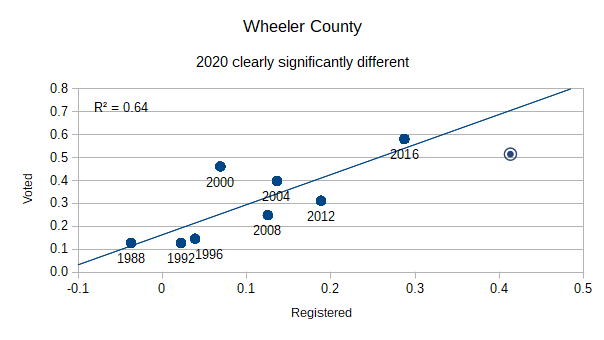
For most of these counties you will see that they registered more democratic until Clinton’s re-election in 1996 when the registration swung much more toward republican. You can also see that they began voting more republican even before the registration shifted.
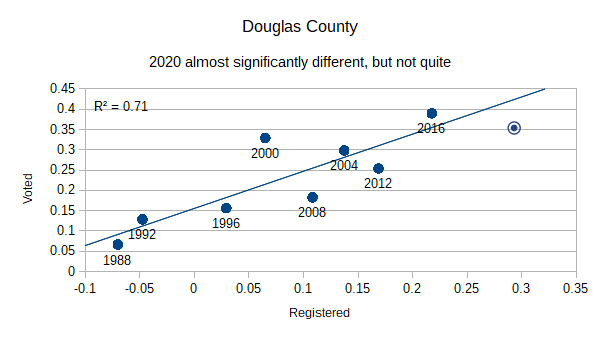
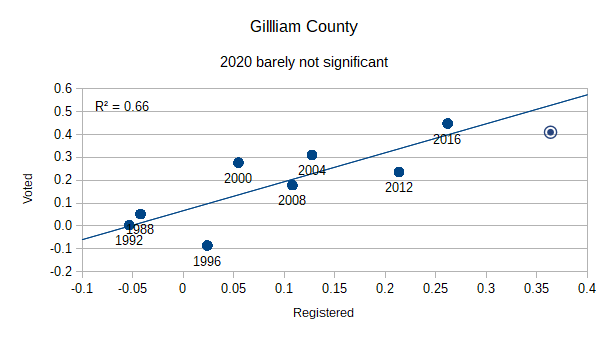
Neither Douglas nor Gilliam counties had a statistically significant difference from the model, but both were very close. The difference for both would be significant if compared to a 98% confidence interval instead of the 99% standard we are using.
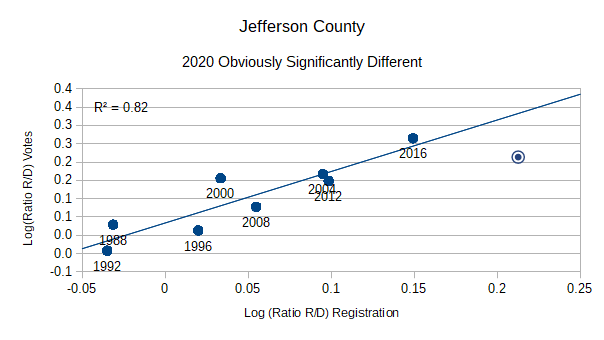
Of all of the Oregon counties, Jefferson county had the most significantly different voting result in 2020, mostly because there was so little variation from the model in 1988 through 2016. Clearly something different happened in 2020.
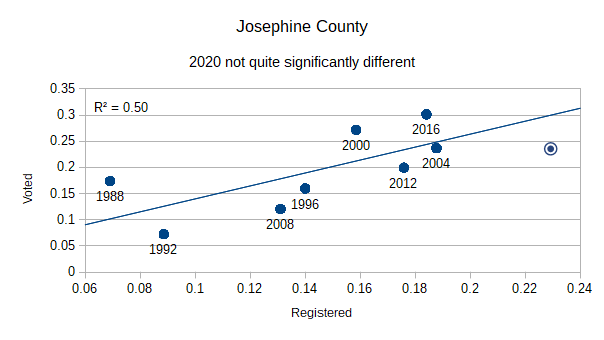
You can see that Josephine has always been republican in both registration and voting, and while the 2020 election difference isn’t quite significant at 99% confidence, again, it is significant at 98% confidence.
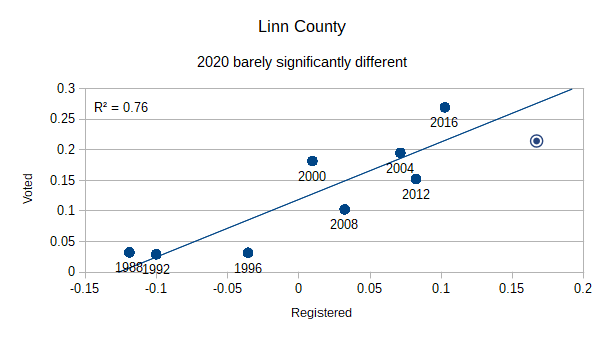
You can see that Linn county continued to be registered democratic through 1996, but the presidential voting clear back to 1988 always favored the GOP.
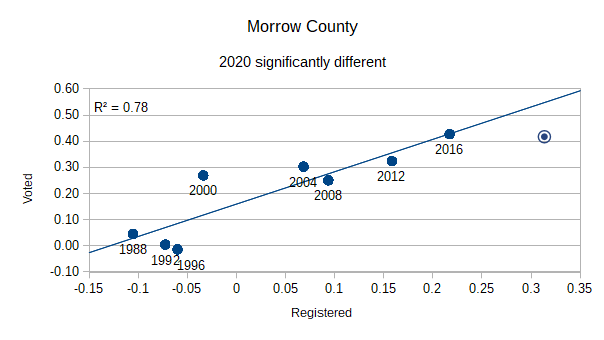
And of course Morrow county continued as primarily democratic in registration until after the 2000 election, and unlike most of these counties even voted for Bill Clinton during his re-election in 1996.
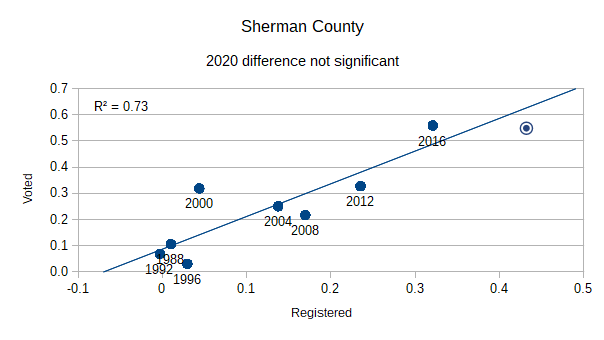
Sherman is the only other county (beside Columbia) for which the difference in 2020 is not significantly different from the model, even at 98% confidence. It is 15% lower than what would be expected, but other years were routinely different. In 2000 the vote was off from the model by 18%.
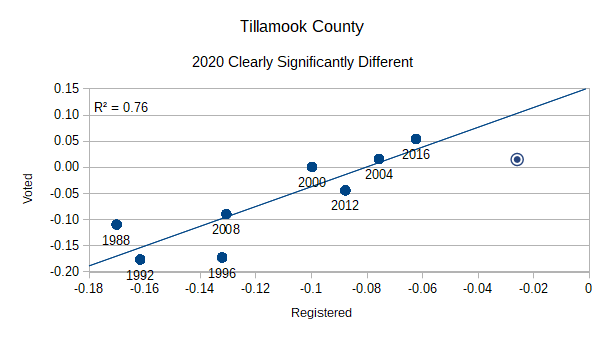
Among these counties Tillamook is different in that even in 2020 it was primarily registered as a democratic county, but barely so at 1.06 registered democrats per registered republican. They swung back and forth over the years, voting slightly for Bush in 2000 and 2004, then for Obama in both 2008 and 2012. but it obviously belongs in this group of counties because it is clearly trending more and more republican over this time period. And of course it obviously voted much more heavily for Biden in 2020 than would be expected.
Sorry for the overload of charts. Mercifully that is the last of these 23 of these counties, and I’m sure you can recognize that they all look pretty similar in 2020, each one voting more heavily for Biden than would be expected.
A patriot’s prayer: Father God, It is easy for us to jump to conclusions when we see unusual circumstances like we see here. But your spirit is a spirit of power, love, and a sound mind. We want and need your spirit to give us that sound mind as we continue on and evaluate what is happening in our state. We need your guidance.
Part 7: The battleground counties
Click the following to see the previous article: Part 5: Counties Trending More and More Toward the Democratic Party