The Oregon Fix - Part 7

Part 7: The Battleground Counties
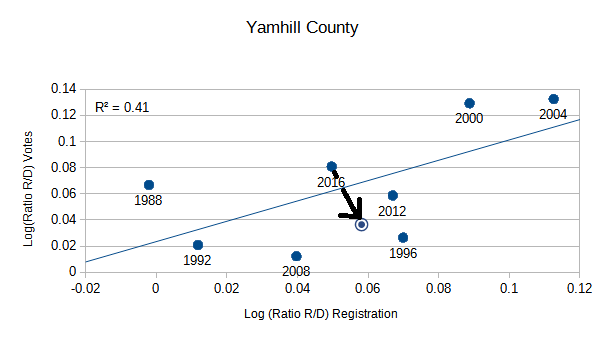
While there are 5 counties clearly trending toward the democratic party in registration and voting patterns, and there are 23 counties which are clearly trending toward the republican party in registration and voting, there are also 8 counties which do not show a clear trend in either direction. Some of these counties are primarily democratic, some are primarily republican, and some switch back and forth over the years. But the factor which they all have in common is in 2020 the registration was not the most extreme for either republican or democratic in their history dating back to 1988. Marion county is a good example as shown below. Keep in mind that 0 on these graphs for either the horizontal or vertical axis indicates an equal number of republican and democratic registrations or votes. Negative numbers indicate more democrats, and positive numbers more republicans.
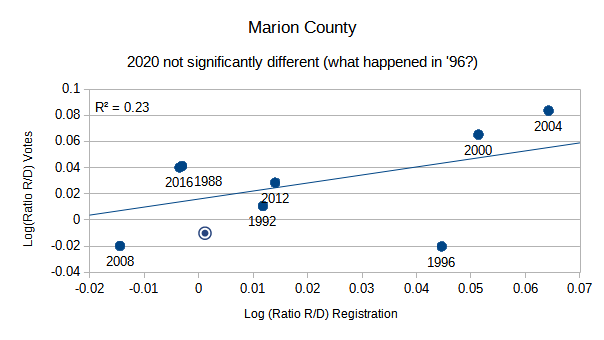
Notice that for the 2020 election they registered more republican than in 2008, 2016, and 1988. But they were more democratic than in 1992, 2012, 1966, 2000, and 2004. You will also quickly notice that 1996 was way off the trend line compared to all of the other years. This was the re-election of Bill Clinton. There are many possible reasons for this, but the fact that it shows up as such an obvious anomaly indicates that this is an unusual event. The important thing to know is that for all of these “battleground” counties the registration of voters is not a very good predictor of how the county will vote. As a result, we can’t make a definitive statement about the 2020 election being unusual in any of these counties except one. That exception is Deschutes county, see the graph below.
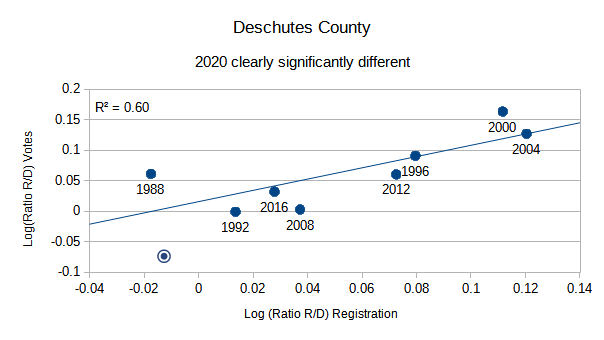
In 1988 this county registered democrat but voted republican. After 1988 the people registered more and more republican and continued to vote republican in the presidential election. In 2008 they were still a republican county in registration but voted about evenly for Barak Obama and John McCain. They then returned to registering and voting more republican in 2012. In 2016 they moved somewhat toward the democratic party, presumably because as the fastest growing area in Oregon people from out of state came in with different political viewpoints. But even so in 2016 they continued to vote slightly more republican than their registration indicated, just as they had done in most of the past presidential elections. In 2020 the shift toward the democratic party continued in registration, but unlike in 2016 they voted significantly more democratic. This was a statistically significant departure from their past voting behavior. This is the only county in this group about which we can make that claim.
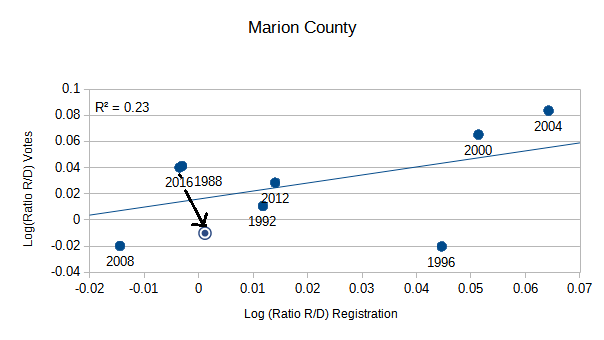
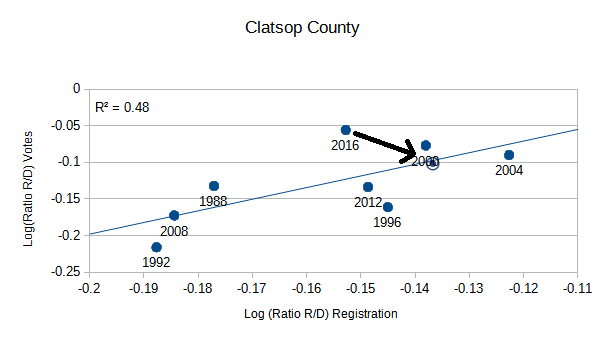
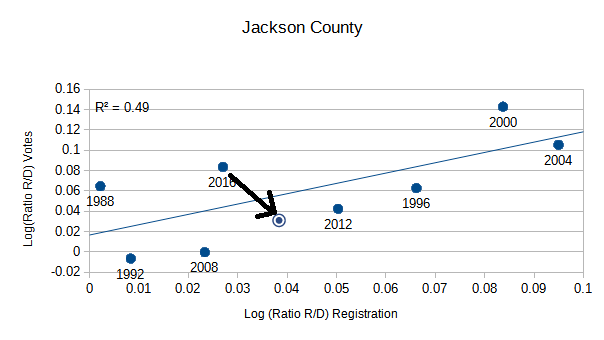
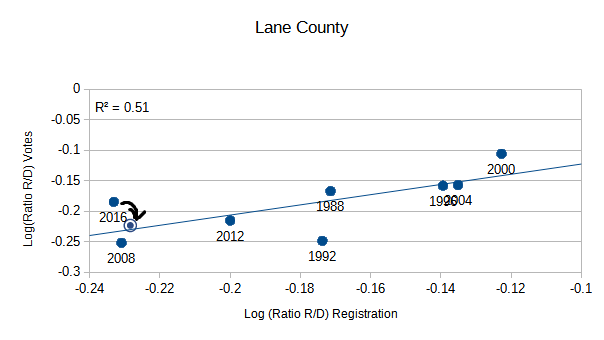
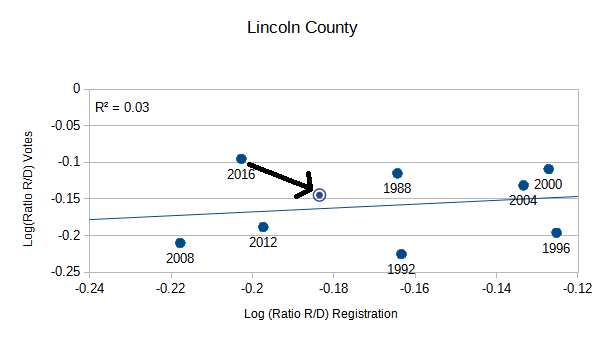
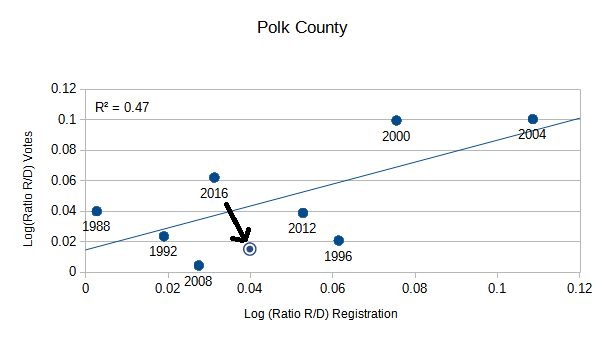
But there is still one thing to notice about these counties. In every case except Deschutes, these counties all registered more republican in 2020 than in 2016. Despite that fact, the vote count in all 8 counties was more democratic in 2020 than in 2016. Take another look at Marion County where that fact is highlighted on the graph, and then look at that phenomenon in every other graph in this group. You can see this happened a few times in the difference between 2000 and 2004 elections, but not every time as it did in 2020. Was there something unusual in 2020 even for this group which didn’t show a strong correlation between registration and voting for president over the years?
A patriot’s prayer: Father God, we need wisdom to know how to interpret this information. Since wisdom begins with a respect and fear of you, we specifically recognize you as the foundation of all that’s good and true, and ask you to show us the truth of what is happening in the election of our state’s governmental leaders.
Part 8: How do we interpret this?
Click this link to see the previous article, Part 6: Counties Trending More and More Toward the Republican Party.