The Oregon Fix - Part 5

Part 5: Counties Trending More and More Toward the Democratic Party
There are only 5 counties in Oregon which are trending more and more democratic in both their registration and voting patterns, Hood River being one of them as we’ve been discussing. But they play an out sized role in their influence on Oregon elections because they contain the three most populous counties in the state. The other four counties are Benton, Clackamas, Multnomah, and Washington. You will see the graphs showing the correlation between registration and voting for three of them. In order to make these graphs be more accurate portrayals of how these counties have been registering and voting since 1988, logarithms will be used to characterize the voting and registration behavior of each county. As a result it will be helpful to make a couple of points regarding interpretation of these graphs.
- The horizontal axis is representing the number of people registered republican compared to the number of people registered as democrats. At zero on the axis there are the same number of registrants for each party. Numbers greater than zero represent a greater number of republicans registered than democrats, and of course the larger the number the more republicans there are for each registered democrat. Conversely, numbers less than zero represent a greater number of democrats registered and the more negative the number the more democrats there are for each registered republican. At 0.3 there are roughly 2 registered republicans for each registered democrat, and at -0.3 there are roughly 2 registered democrats for each registered republican.
- In the same way the vertical axis on each graph follows the same rules but for votes. Zero represents voting as an exact tie in voting between the republican candidate and the democrat candidate for president. +0.3 represents 2 republican votes for each democrat vote, and -0.3 represents 2 democrat votes for each republican vote.
- The point representing the 2020 election is not represented with a label but with a circle around the dot. I looks like this:
- In the first graph for Washington county the areas on the graph representing where the county would both be registered and vote democratic is shown in light blue shading, and the area of the graph where the county is both registered and votes republican is represented with light red shading. The areas without shading (i.e. in white) is where the county registered one way but would have voted another.
- Statisticians: The numbers the horizontal axis are the base 10 logarithm of the ratio of republican registrations to democratic registrations. And the number on the vertical axis is the base 10 logarithm of the ratio of the republican votes to democratic votes. Or Log(R/D) registrants or votes.
With this as a background have a look at Washington County with some annotations to help us get used to this last type of graph which will lead us to easily picture the behavior in each county.
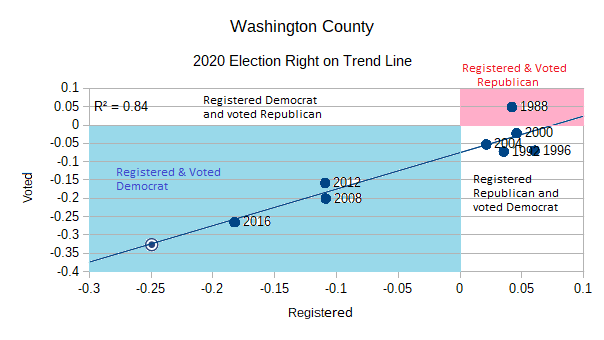
Looking at this graph you can see that in the elections from 1988 through 2004 the county had more registered republicans than democrats (the dots representing those elections are further to the right), but after 1988 they began to vote more democratic (the dots are below the zero line and the red shaded area). You can also easily see that a dramatic shift toward registering and voting democratic began in 2008 (the 2008 dot was well into the blue shaded area), and has mostly continued moving more and more democratic through the 2020 election. The line represents the mathematical model which predicts how the county would vote based on their registration according to the results of the elections from 1988 through 2016, and you can see that the voting patterns in 2020 were almost exactly in line with how the county voted in past elections. So once again, the model is a good predictor of how people actually voted in this county.
Two of the other democratic trending counties show the same trends as shown by these graphs:
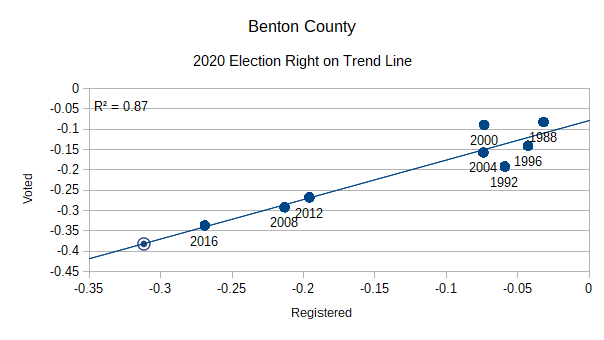
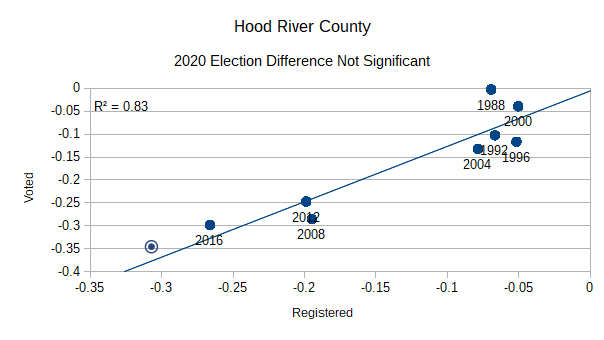
Both Hood River and Benton counties have in general been registered and voted democratic since 1988. The same can be said for Multnomah county but there is a little difference. Here is the graph for Multnomah:
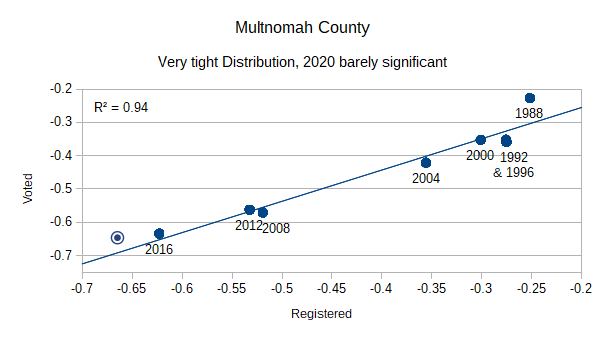
Visually this looks similar to Hood River, but when you run the statistics on it you find that 2020 was actually slightly different from past elections. The difference was only 1.47%, but since the past elections in Multnomah followed the trend line so closely this difference is statistically significant (at 99% confidence, using a two tailed test). So it can be said with a fair degree of confidence that Multnomah actually voted more strongly for Trump in 2020 than would be expected based on the county’s voting history. It interesting to note that the same can be said for the 1988 election.
Clackamas county is unique in a different way.
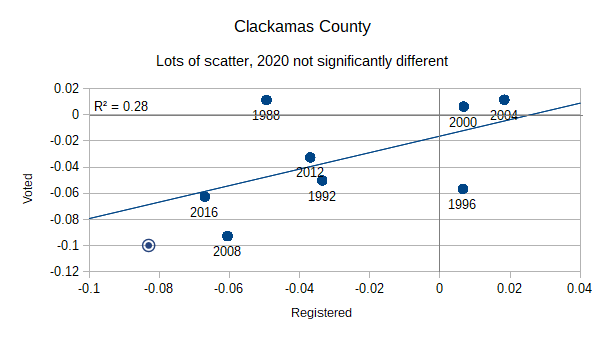
Basically, Clackamas county did not consistently follow their registration pattern at all. In 1988 they voted republican even though being registered more democratic. In 1992 they registered slightly more republican but voted more democratic. They voted for Clinton in 1992 and 1996, but starting in 1996 they had more republican registrants and voted for George W. Bush in the next two presidential elections. Then beginning in 2008 they swung much more democratic in both registration and voting, and only wavered away from that a little in 2012. The R2 number shown in the upper left corner of each graph is a measure of how well the various elections fit the mathematical model. Unlike most of the counties in Oregon, the voting behavior in Clackamas county is not easily predicted. So even though the variation from the model was 2.44% in 2020 (much larger than Multnomah’s 1.47% variation) it cannot be labeled as a statistical aberration because that kind of variability is normal for this county. Common sense tells you that the 2020 election in Clackamas doesn’t look too unusual. In these articles the graph for each county will be labeled with a statement about whether the 2020 election was different from what the model predicts.
A patriot’s prayer: Father God, Solomon said it was the glory of God to conceal a matter, but the glory of kings to search out a matter. We aren’t all kings, but we have some resources to use in this search for truth, and feel honored and grateful to have the opportunity to search out this matter.
Part 6: The counties which are clearly trending Republican show a big surprise.