The Oregon Fix - Part 4

Part 4: 2020 Expectations
By now we are more than ready to see a prediction of the 2020 election based on the historical results. One more graph is needed, but once you see it, the answer will be quite obvious. This graph merely takes the two simple ratios (registration and votes democrat ÷ republican) we graphed in part 3 and plots them against each other, registration ratio on the horizontal axis, and vote ratio on the vertical axis. There is a clear trend line which the computer can plot for us.
First Hood River County
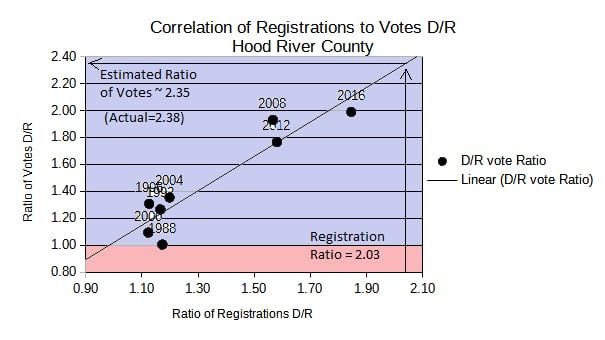
From this graph it is very easy to see in each presidential election how an increasing ratio of registrations for the democrat party have correlated to an increasing ratio of votes for the democratic candidate for president. So now we can take the registration ratio from 2020 which was 2.03 registered democrats for every republican registered, and use that to estimate the vote ratio to be about 2.3 votes for Biden for every vote cast for Trump in 2020. The actual ratio of the presidential votes is 2.38 based on a graph which is more technically accurate, but the numbers in that graph are pretty esoteric and difficult to relate to real life. And honestly (apologies to the statisticians), the graphical representation below is very close to reality.
These 2020 results are shown below:
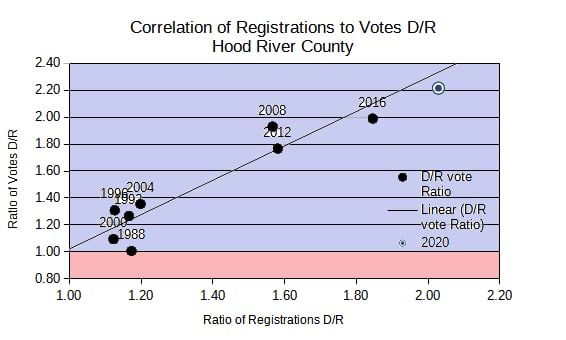
The 2020 election in Hood River county was just about what we would have predicted! The county voted just slightly more for Trump than might be expected, but it looks very much in line with past years. Using the more technically correct analysis, the statistics say that this is not significantly different from the predicted model (95% confidence 2 tailed t analysis). If there were 277 fewer republican votes, the 2020 results would have been perfectly on the modeled line. So out of the 13,090 total votes cast in 2020, the difference was only about 2.1%.
And Morrow County looks like this:
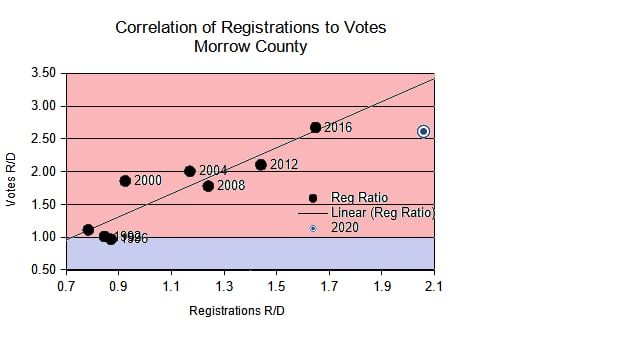
So unlike Hood River County, Morrow county’s 2020 results look quite a bit different than we would expect! They voted much more heavily for Biden and much less for Trump than would be expected. With 356 extra Biden votes than would be expected, out of 5096 votes cast, that’s a difference of 7.0%. Visually, it looks unusual, and statistically it is unusual (again doing a 2 tailed t test at 99% significance).
So what should we make of this? Is this a one off occurrence? Is it important?
A Patriot’s prayer: Father God, as is often the case, I don’t know what to pray here, except that your rule and reign would come, and your will and desires be carried out here on earth, including the way that this analysis affects people’s attitudes and minds. May this drive us all to a greater dependence on you, even though it may show information which is disturbing to us.
Part 5: The 5 counties trending more and more toward the Democratic party.