The Oregon Fix - Part 3

Part 3: Keeping it Simple
In part 2 we tried to discover if there was a way we could use voter registrations to make predictions about how people might vote in the 2020 presidential election. But what we found is that there is a lot of difficult and nuanced data to wade through, especially regarding non affiliated voters (NAV’s). So the question becomes, how do NAV’s tend to vote? The simple answer is that they probably vote similar to the other people in the county. Don’t we all tend to have similar opinions as our friends and associates? There will always be some people from all parties who will vote for third party or write in candidates, but the last time that the president wasn’t either a democrat or republican was before the civil war. So as a simplifying assumption we will say that the NAV’s and people registered to the smaller parties will in the aggregate vote similarly to the people registered in the two major parties.
So in order to express in a way that we can all understand at a glance, we will look at the registrations and votes of the people as a ratio of republican to democrat. If we are in a republican county we might have 2 registered republicans for every registered democrat. That would be graphed as a 2.0 on a chart, since 2÷1=2. Conversely if there are two registered democrats for every republican, we would graph that as a 0.5 on the chart since 1÷2=0.5. We will not look at the total voter turnout, or the third party turnout, but only the ratio between the republican and democratic votes and registrations. And we will start with our two extreme counties which we examined in part 2, Morrow County and Hood River County. The area where each county is democratic in either voting or registration is shaded in blue, and the area where the county is republican is shaded in red.
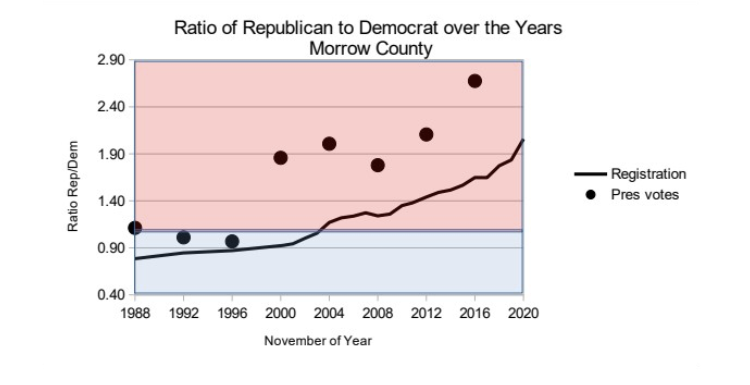
For Morrow County it is now very clear. At a glance you can see that as a county they have been trending more and more republican in their registration and voting since 1988. And we see at a glance that they have always voted more republican than their registration indicates, and that has especially been true since 2000.
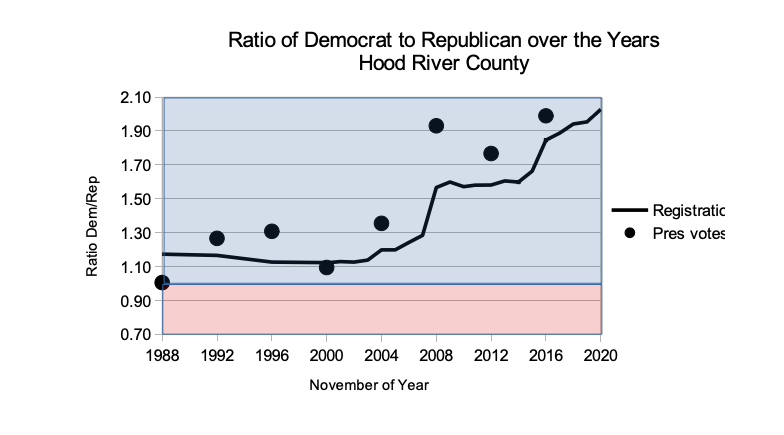
For Hood River County, we will reverse the ratio since it is a democratic county, but it is also very clear. At a glance you can see that they have been democratic in both voting and registration during this entire period, and in 1988 and 2000 they voted more republican than they were registered. But after 2000, and especially in 2008 they have trended steadily democratic in both voting and registration.
Getting back to our original question, is this a good predictor of voting behavior? Yes! It is now easy to see that in a broad sense when registrations become more democratic, the votes turn more toward the democratic party, and vice versa. And it is important to note that in 1992 when Ross Perot had a significant influence on the presidential election as a third party candidate, this method of using a ratio to predict voting behavior was still in line with the broader trends. So even if there is a serious third party candidate contender in the election, just looking at the ratio between the two major candidates is a reasonably good predictor of how the vote is likely to turn out.
For the statisticians, the correlation coefficient r between registrations and votes is 0.904 for Morrow county, and 0.881 for Hood River county, both quite good.
A Patriot’s prayer: Father God, we can do some mathematical calculations and make a guess at the truth, but it is often hidden from us. You said you would give your spirit to guide us into truth, and how much better is that than our guess. It is futile to try and figure out what happened in the Oregon elections without your guidance.
Part 4: If history held true what might the 2020 election have looked like?