2020 Presidential Election Analysis Summary

Coos County, Linn County, Klamath County
Using records provided by several County Clerk’s Offices, we compared the events of the tabulation process in various counties, comparing the vote totals, margin of victory, and Biden to Trump ratio. We used records which were time-stamped, so we were able to replicate the way the votes came in and were counted for the Presidential race.
According to the data, Democrats in Oregon generally return their ballots early, well ahead of election day. It’s quite interesting that this pattern is the same in multiple counties considering the state votes by mail, and ballots are returned randomly, depending on the voter’s schedule. It’s also interesting that the Democrats had a stronger start than finish.
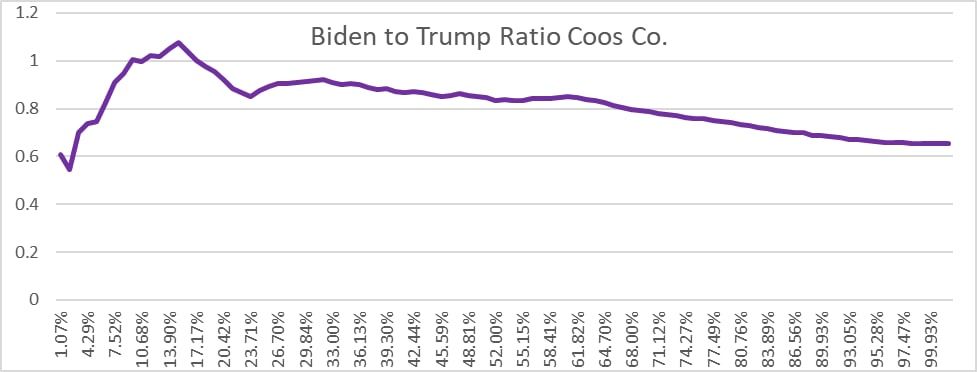
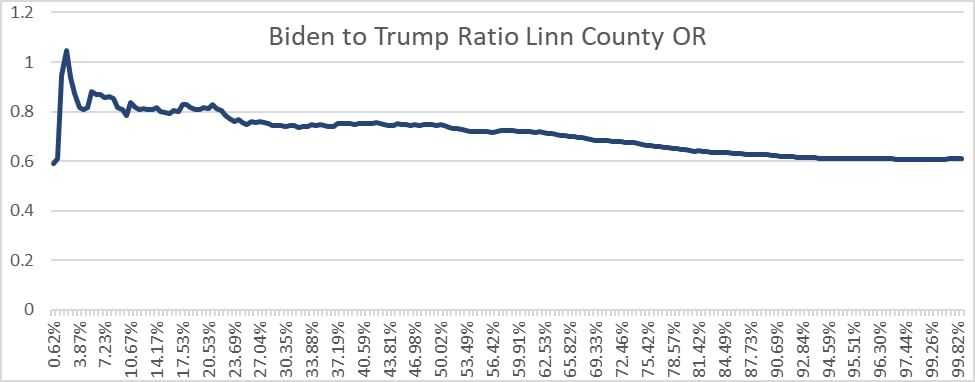
In all counties we looked at, the ratio of Biden to Trump votes in the beginning was much higher than it was at the end.
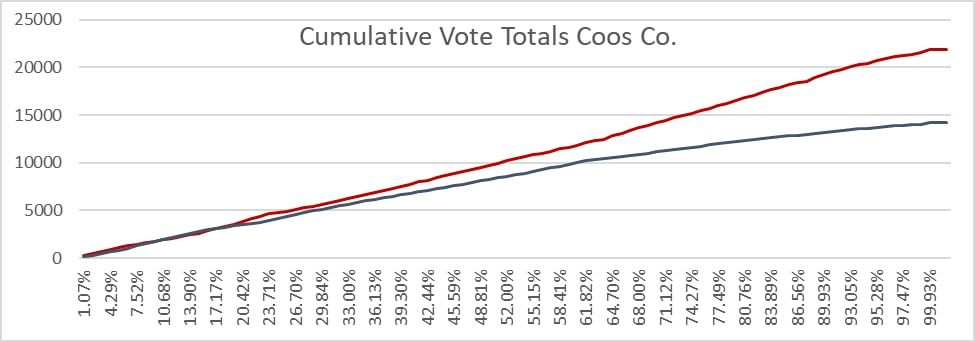
In the Coos County 2020 general election, Coos County Oregon began scanning ballots for tabulation on October 27th. By the end of the day on the 27th, 40.83% of Biden's votes for the election had been counted, while 29.6% of Trump’s total votes were counted. By the end of the 28th, 62.33% of Biden’s votes and 48.8% of Trumps votes were counted.
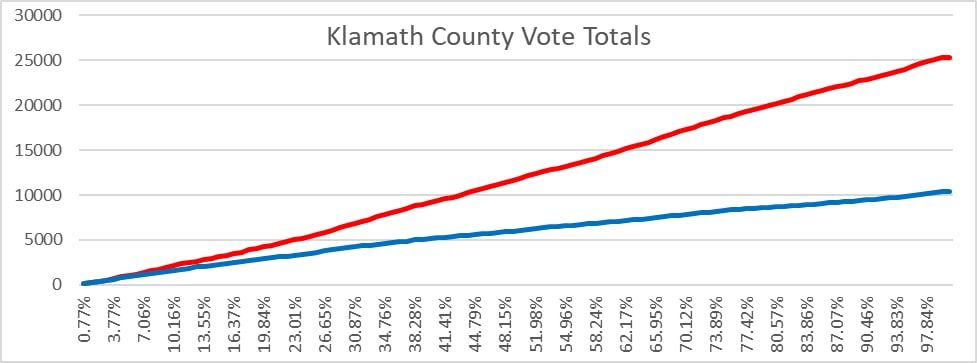
In Klamath County, they started scanning ballots on October 28th. By the end of the day, 28.19% of Biden’s votes were counted, and 19.84% of Trumps votes were counted. Similar to Coos County, the bulk of Biden Votes were scanned in the first couple days.
Some may argue that this is simply because Democrats vote earlier than Republicans. It’s also possible that this is a result of a pre-load of ballots early in the counting process, a head start given to certain candidates, or a result of manipulation through adjudication to the early ballots.
This is not just the pattern in Oregon. Washington State has the same voting patterns going on as well. One thing the two states have in common is the vote by mail methods. Is voting by mail the cause of the early Democrat turnout?
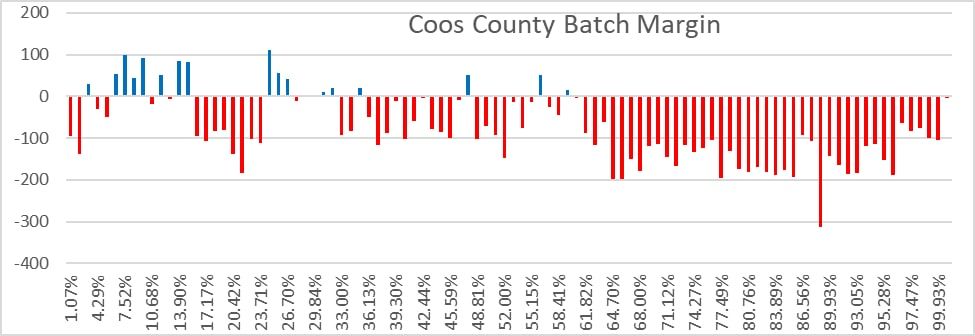
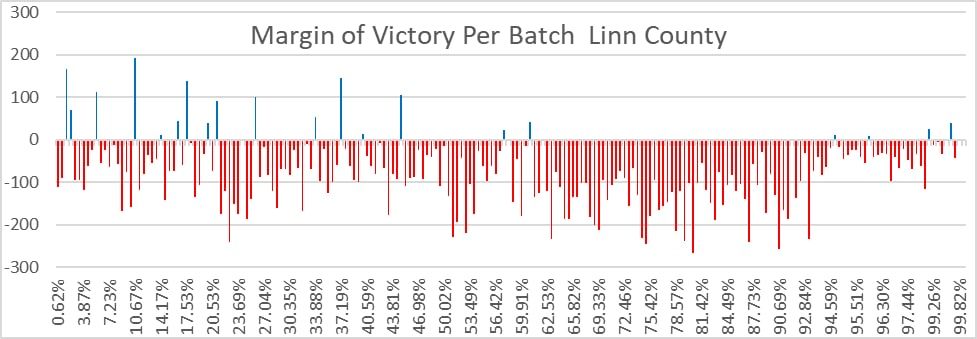
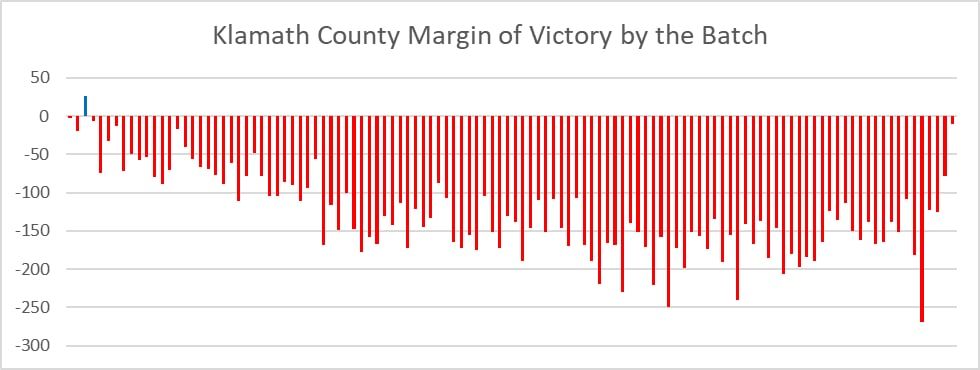
The graphs below show the margin of victory for each batch of ballots that was scanned, in the same order they were processed by the county when tabulating the votes. Blue lines going up represent a victory for Biden, and red lines going down are a victory for Trump. Each line is a different batch. The longer the line, the larger the margin of victory. So, a short line means that batch was only won by a few votes, and a long line means the candidate won that batch by many votes.
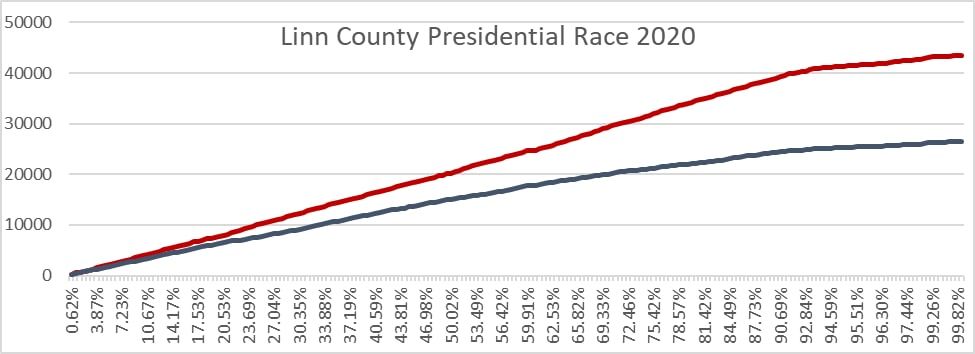
Here are the cumulative vote totals over time for each of the three counties. This was found by adding up the total votes after each batch was processed. Red lines represent Trump’s vote totals, and blue lines are Biden’s vote count.
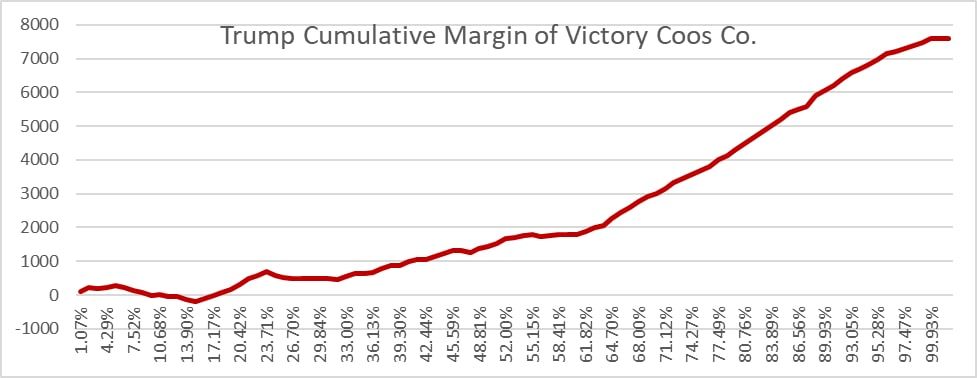
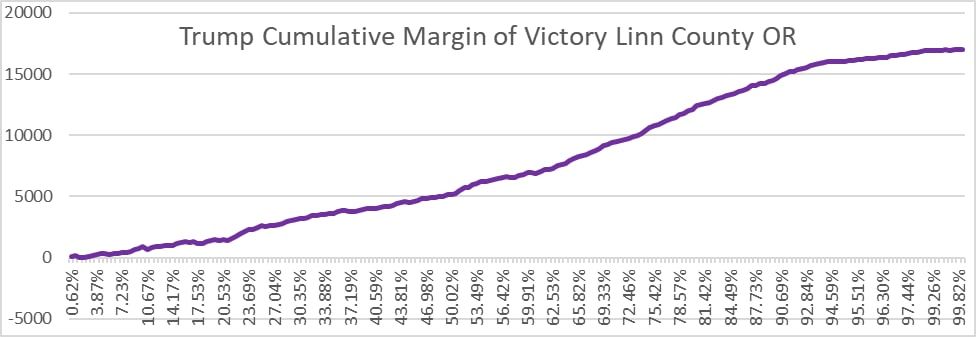
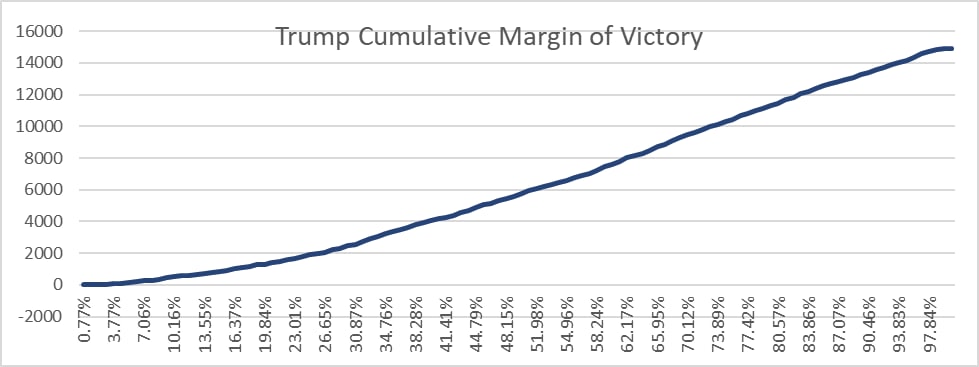
Cumulative margin of victory for the winning candidate.
Below is the cumulative ratio of Biden to Trump votes. (Biden votes/Trump votes) Typically we would expect these to flatten out and reflect the final ratio after roughly 10% of the ballots were counted. The line should be fairly flat after that. However, they do not actually flatten out at all. This is due to the Democrat votes being much heavier in the beginning of the vote counting and then fading out as the election continues.